Dec 9, 2021
Query latency vs. throughput as a database tuning objective
Ruogu Du | Bohan Zhang | Andy Pavlo

When automatically tuning database configurations, the OtterTune default optimization objective is now 99th percentile query latency. You may be wondering why. Here’s a bit more about why we chose query latency and the reasons behind why computing that metric is tricky.
Why we now use query latency as our target objective
OtterTune provides several target objectives for users to choose from when they are ready to start tuning their database, but some are less effective for certain workloads. For example, consider an application that has a peak throughput of 10,000 transactions per second during business hours, but then drops to 100 transactions per second outside of those hours.
Throughput is generally not a good target objective for applications that have daily workload patterns such as this one because it varies with the time of day — it’s dependent on the application.
As a result, the configurations OtterTune tries outside of business hours will appear to have “worse” performance (lower throughput), even for high-quality configurations. Throughput is a suitable target objective for tuning over-utilized databases, but this scenario is not common for real-world applications.
The query latency, however, is less dependent on the application and does not strongly vary with demand like throughput does. We can improve query latency by tuning the database, making the database faster, whereas we can only increase the throughput if the database is over-utilized.
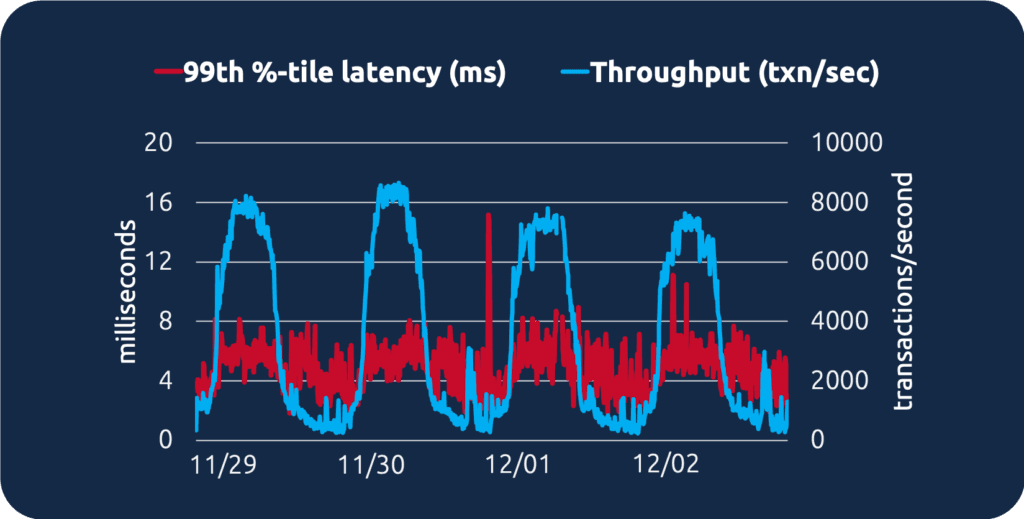
This is the reason that most companies define their service-level objectives (SLOs) in latencies. To illustrate the difference, here’s a graph showing how the 99th percentile query latency measurement stays more consistent over time, even as transaction throughput varies more widely:
AverageLatency vs. 99th percentile query latency
Previously, OtterTune provided customers with Throughput and AverageLatency (average ReadLatency + WriteLatency from Amazon CloudWatch) as the target objectives. However, some customers found these insufficient for their demands, especially when AverageLatency could not accurately describe the overall latency situation. This happened whenever long-tail transactions were given more emphasis than average ones.
The other issue with CloudWatch’s AverageLatency metric is that it measures disk I/O latency, not query latency. It’s therefore not a good indicator of database performance. To meet the needs of customers, OtterTune developed a set of target objectives of latency percentiles.
How OtterTune calculates 99th percentile query latency
Computing 99th percentile query latency so it can be used to tune the database is technically challenging. In most other instances, OtterTune collects numeric counters maintained by the DBMS and uses those as metrics for tuning. 99th Percentile Query Latency is an exception — OtterTune must compute latency based on the query digest, which is maintained by the DBMS. In addition to that, developing target objectives for latency percentiles differs for every database. Here we discuss how to get latency percentiles directly from PostgreSQL and MySQL’s internal metrics, without using external monitoring tools.
Calculating query latency for MySQL
For all supported MySQL versions, we can use metrics in the performance schema to compute the query latency. Specifically, we use performance schema summary tables, which contain aggregated information for groups of events over time. (Note that you can enable the performance schema in Amazon RDS by activating Performance Insights.)
MySQL 5.6/5.7
For MySQL 5.6 and 5.7, we can use the events_statements_summary_by_digest in the performance schema to approximate the latency percentiles.
Events_statements_summary_by_digest: provides aggregated information for each statement digest. We can get the number of executions and average/min/max latency for each statement digest. We then approximate the latency percentiles using the number of executions and average latency.
Query statement digest:
MySQL’s statement digest tables store the normalized SQL statements. For example, consider the following statements:
Both of these statements have the same normalized SQL in the statement digest:
Steps:
We query the following data from the digest table:
Digest: statement digest value
Count_star: the number of times the statement digest was called
Avg_timer_wait: the average execution time of the statement digest
Query:
Example:
For each statement digest, we assume every call (count_star) takes the same average time (avg_timer_wait). This lets us approximate the execution time for each statement. We can then sort the execution times and compute the latency percentiles.
In the results above, we have two statement digests, D1 and D2. D1 executes 9 times, the average latency is 1ms. D2 executes 1 time, the average latency is 2ms. If we assume each execution of D1 has the same latency (1s), then the approximate 90th %-tile latency is 1ms.
MySQL 8.0
Starting from MySQL 8.0, the performance schema provides the histograms of the statements latency to give better visibility of the distribution of data. The accuracy of the latency percentiles computed from these histograms is much better than the approximation we get when using the statement digest data in MySQL 5.6/5.7. OtterTune uses data from the events_statements_histogram_global table to compute the latency percentiles for the global system.
Events_statements_histogram_global: summarizes latencies globally across schema and query digest using a single histogram.
Steps:
We query the following data from the histogram table:
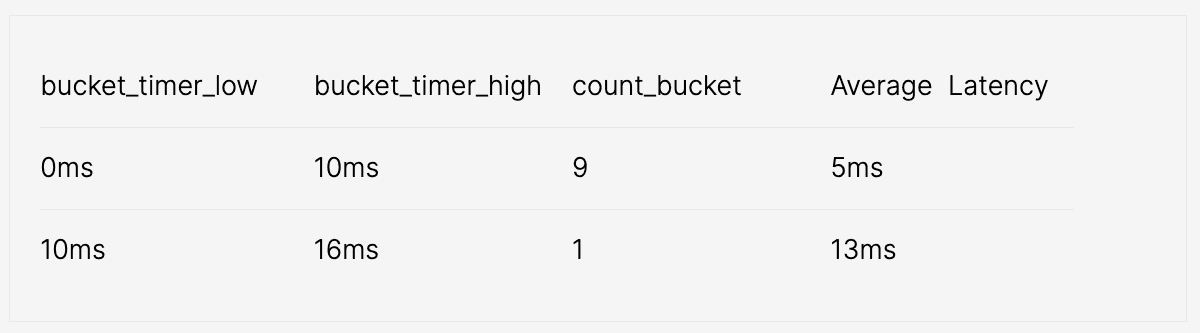
Bucket_timer_low: lower latency bound for this bucket
Bucket_timer_high: upper latency bound for this bucket
Count_bucket: number of statements measured with a latency in the interval [Bucket_timer_low, Bucket_timer_high).
Query:
Example:

The results above returned two bucket entries. The first entry shows that 9 statements were executed with latency in the range [0ms, 10ms). The second has 1 statement executed with latency in the interval [10ms, 16ms). We compute the average of the upper/lower latency bounds for each bucket, which are displayed in the “Average latency” column. If we assume all statements in a given bucket have the same average latency, then the 90th %-tile latency is 5ms.
Calculating query latency for PostgreSQL
With PostgreSQL, for example, we can leverage the pg_stat_statements module to compute query latencies.
pg_stat_statements: this module provides planning and execution statistics of all SQL statements executed by a server.
Prerequisite: You’ll need to load the module on the database if it does not exist.
Steps:
We query the following data from the table:
Queryid: identifier for normalized statements
Calls: the number of times the statement was executed
Mean_exec_time: average time spent executing the statement
Query:
We can then compute the latency percentiles the same as we did with MySQL 5.6/5.7: For each normalized statement, we assume every call (calls) takes the same average time (mean_exec_time) to execute. We can then sort the execution times and compute the latency percentiles.
Getting to the right target objective for your business
Despite the difficulties, it is important to select a good target objective because OtterTune will optimize for it when creating new configurations for your database. Keep in mind that you can guide OtterTune toward optimizing performance versus cost. Also, it is possible to configure OtterTune to optimize for other objectives in a database, such as CPU utilization or storage IOPs. The query latency tuning objective capability is available in all versions of OtterTune.
The OtterTune documentation provides more information about selecting a good target objective and tuning for specific databases.